Line of sight and coverage offshore
One of the most frequently asked questions we receive is “100km is beyond the line of sight. How do you manage to increase coverage offshore beyond the line of sight”?
The answer to that question is more complex than the line of sight, as there are factors that play a role into how far signal can travel. Reflection on water is one of those. Humidity and other climate factors also play a significant role and can either extend coverage or decrease it.
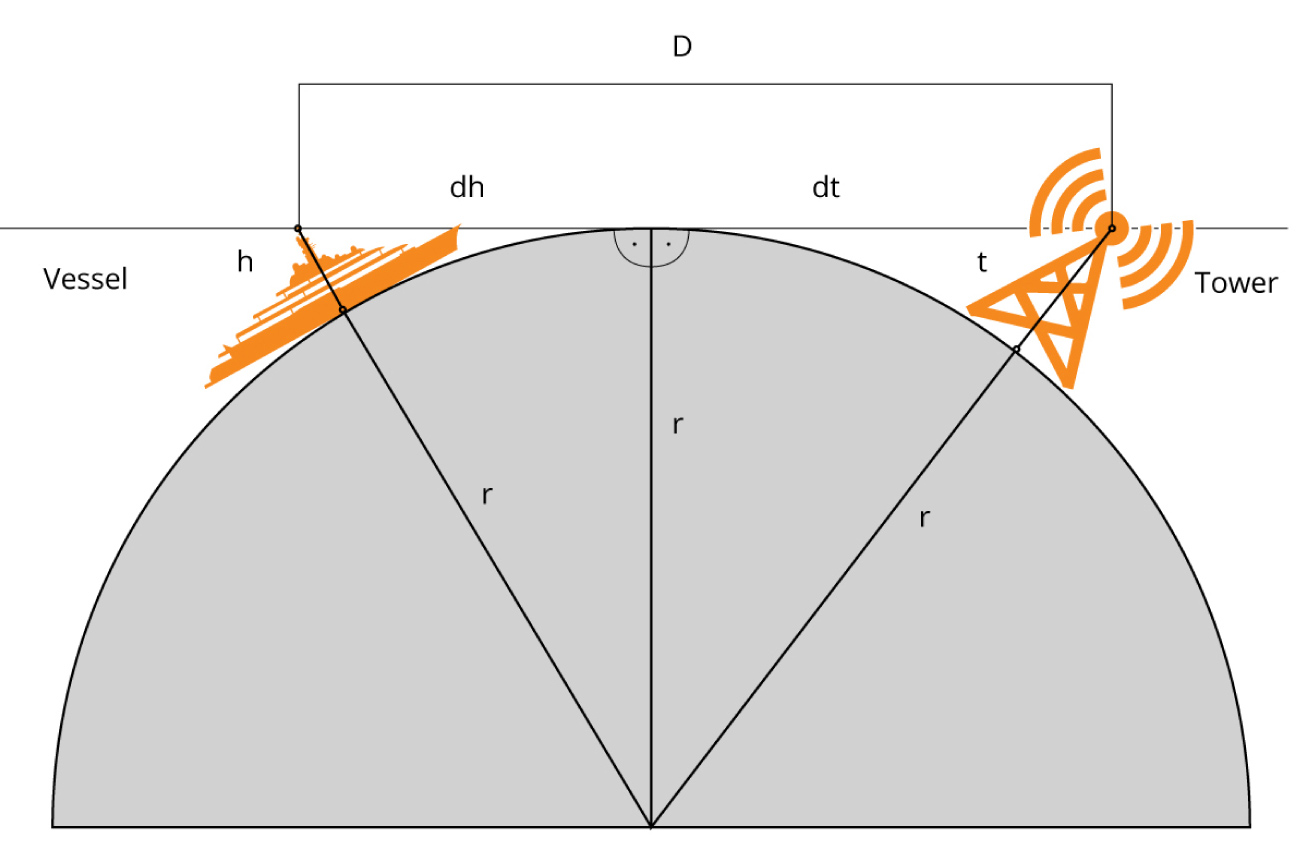
That said, line of sight that you can observe from shore at sea level to another object at sea level is 10km. However, the dome installation and the height of the tower / location are not at sea level.
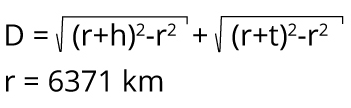
You can find an offshore coverage calculator based on the elevation of the dome on the mast and the elevation of the tower nearby.

Radio Line of Sight Distance Calculator
Tower elevation
300
Mast elevation
20
Line of sight:
Example of tower Elevation, real world
(meters)
Tower (km)
Europe
The US/Bahamas/ Caribbean
Other
*** You can find tower height information in various locations here. Please use this as a rough guide only as such information is usually not 100% up-to-date.
Dome Elevation, real world yachts
(meters)
(meters)
Vessel (km)
(avg) in km
There are factors that play a role into how far signal can travel that can increase or decrease offshore coverage. For example, reflection on water is one of those. Humidity and other climate
factors also play a significant role.
You can also take a look at our testimonials page and videos showing speed tests done at various destinations / distance offshore showing real-life data.